Statistics with Data science using Python
WEEK 1 : Introduction
- Basic Introduction to Data Science.
- Data Science Impacts and Importance.
- Why Mathematics and Statistics is important?
- Real-life application.
- Introduction to Google Colab.
- Python syntax and data types.
- Basic arithmetic and algebraic operation.
- Basic codes using Python (Print your name, sum, difference, etc)
- Python keywords.
Week 2 : Understanding Data
- What is Data?
- Qualitative vs Quantitive data.
- Primary and Secondary data with real-life examples.
- Data representation using statistical tools.
- Discrete vs Continuous data.
- Bar chart, histogram, line diagram, pie-chart.
- Concept of measure of Central tendency.
- Difference between Arithmetic Mean, Geometric Mean, and Harmonic Mean.
- Impact of Median in our real life.
- Calculate Mode.
Week 3: Python Code
- If- else condition in Python.
- Python code using condition.
- Python Loops and types of loops.
- Basic Mathematical code using for loop.
- Pattern code using for loop.
- Basic Mathematical code using While loop.
- Break and Continue statement in Python.
- Assignments.
Week 4: Statistics with Python
- Measure of Dispersion.
- How do you calculate the range of any dataset?
- Why do we calculate various types of deviation?
- Calculate Standard and Mean Deviation.
- Import NumPy Libraries.
- Calculate basic calculations of Statistics using NumPy.
- Assignments
Week 5: NumPy library
- Create a Matrix.
- Array Creation.
- Array Operation.
- Indexing and Slicing.
- Shape Manipulation.
- Mathematical Function.
- Statistical Function. Assignment.
Week 6: Basic of Probability
- Introduction to Probability.
- Coin Problems.
- Dice Problems.
- Cards Problems.
- Concepts of Basic set theory.
- Venn Diagram, Union, and Intersection.
- Python Program to solve probability problems.
- Assignments.
Week 7: Arithmetic and Algebra
- Distance, time, and speed problem using Python.
- Ratio and proportion real-life problem solving using Python.
- Percentage calculation
- Simple and Compound Interest.
- Basic Mensuration problem using Python.
- Basic Trigonometry.
- Application of Trigonometry using Python. Assignments
Week 8: Pandas Library
- Introduction to Pandas Library.
- How to create a data frame and its importance.
- How to read data from CSV OR JSON files.
- Data cleaning using Pandas.
- Clean wrong format, wrong data, Duplicate values.
- Data Manipulation.
- Group-By function, Merging, and joining. Assignments.
Week 9: Data Visualization
- Introduction to Matplotlib Libraries.
- Pyplot in Matplotlib.
- Scatter plot.
- Bar Chart and Histogram using Python.
- Pie-chart using Python.
- 3D plots.
- Work with real-life data.
- Assignments.
Week 10: Machine Learning
- Data cleaning.
- Supervised vs Unsupervised Learning.
- Introduction to Scikit-Learn library.
- Concepts of correlation.
- Concepts of linear regression.
- Use Linear Regression using Python.
- Advantages and Disadvantages of linear regression.
- Concepts of Multiple Regression, Logistic Regression.
- Projects.
Week 11: Deep Learning
- Classification and Clustering
- Real-life examples of different machine learning algorithms.
- Concept of AI.
- How to use ChatGPT.
- Concepts of Deep Learning.
- Importance of Neural Network.
- Image recognition using deep learning.
- Introduction to NLP. Projects.
Week 12: Project with QNA
- Project discussion.
- QNA Season.
- MCQ test for mathematics & Statistics.
- Coding test for Python.
US / Dubai / Singapore Price
$100 / month
- Course Duration : 12 weeks/ 3 months
INDIA PRICE
(For residents of India Only)
₹6000
- Course Duration : 12 weeks/ 3 month
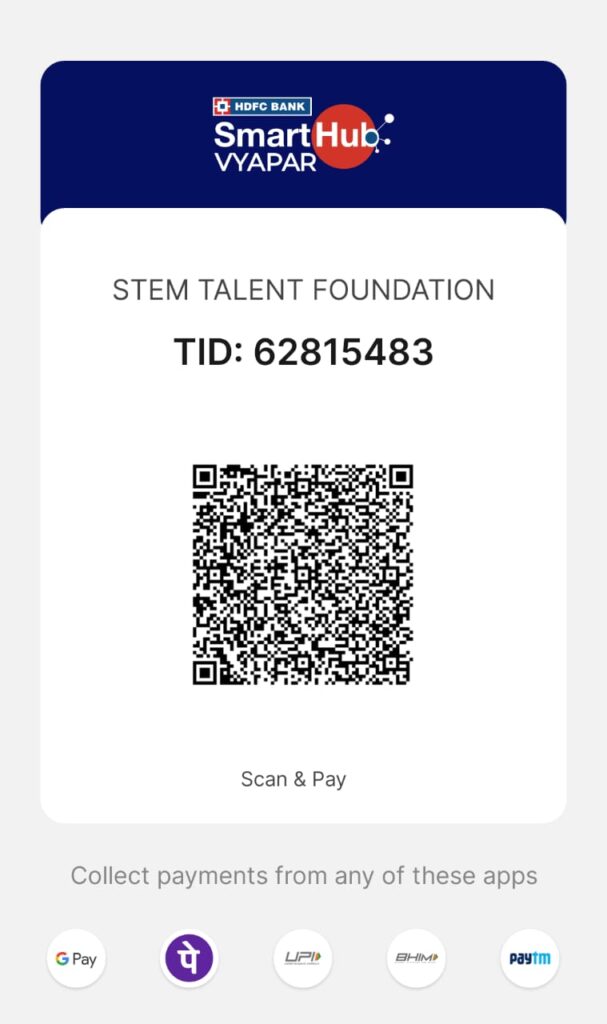
Pay using QR Code

Experts

Sourish Sarkar
Master of Science in QMS
Indian Statistical Institute
Statistical Quality Control , Operation Research
